|
Futures & Options Brokerage |
|
Futures & Options Brokerage |
|
Black Oak
Contact Info
Markets
Calendar
Weather
|
How Is Your Corn Investment Doing?
As we come to the end of the first week of September, meaning the first week of the new quarter of the new marketing year, we can take a moment to evaluate how our theoretical long-term investment positions in the corn market are doing. As you’ll recall, my investment market of choice is indeed corn for a number of reasons including Peter Lynch’s advice of “invest in what you know” and my own belief that corn is the bonds (as in Treasury, not James) of the Grains sector. And while I recently asked the question if the National Cash Index could hit $2.50, my long-term investment strategies in the market have not changed. For the record there are two avenues I look at: A December contract only futures fund and the Teucrium CORN ETF ((CORN). Today, I’m going to focus on the futures market. 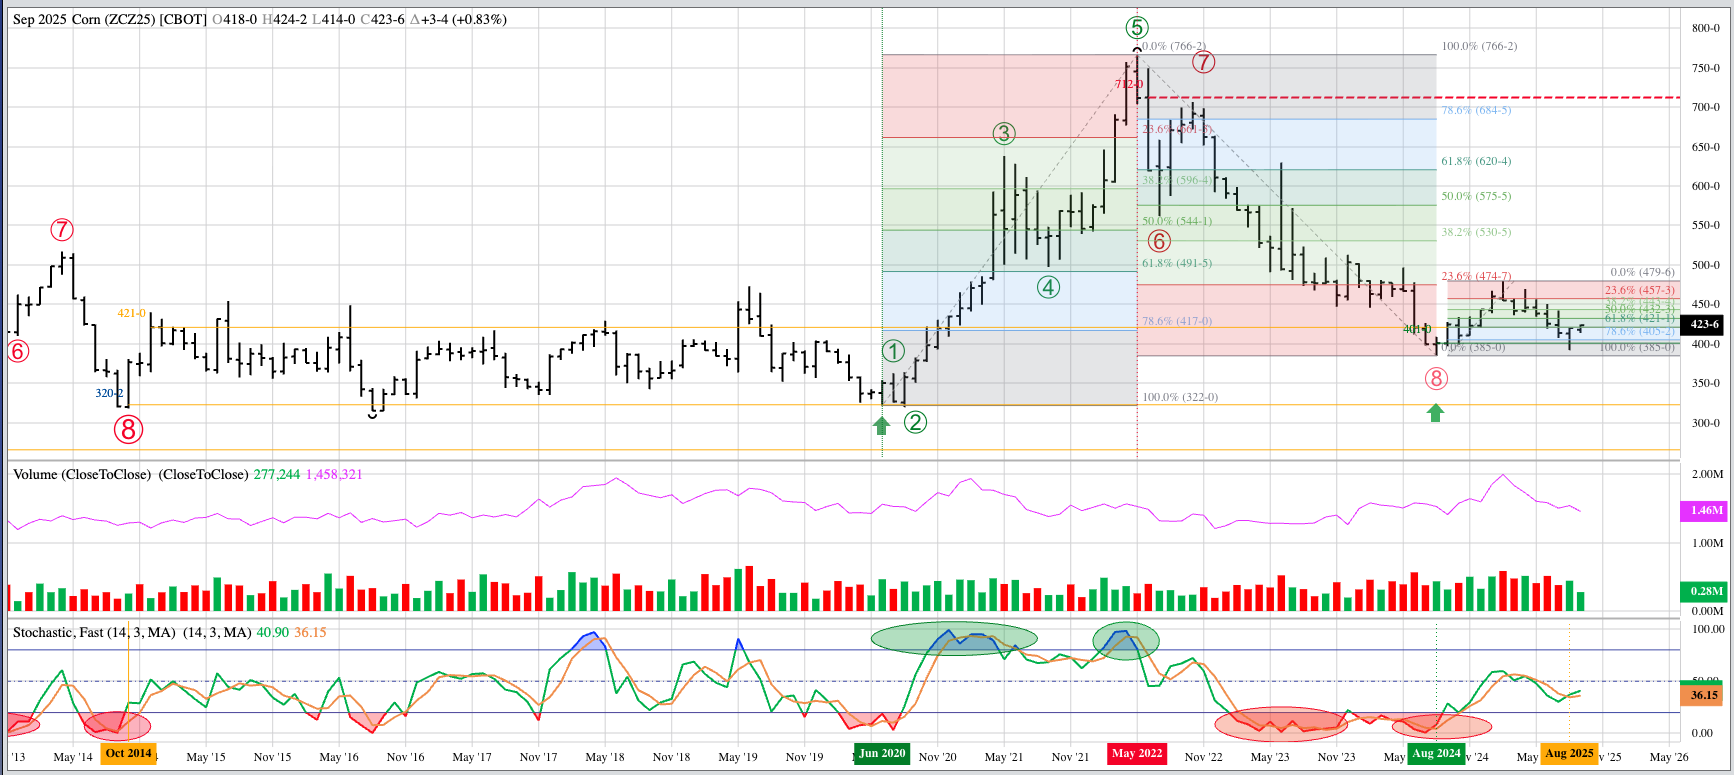 From a technical analysis point of view, the Dec-only continuous monthly chart turned bullish at the end of August 2024 based on the completion of a bullish spike reversal. This ended the previous long-term downtrend that began at the end of May 2022 as a bearish spike reversal was completed. Along the way, the nearby December futures contract fell from $7.1150, the Dec22 contract end of May settlement, to the Dec24 end of August 2024 close of $4.01. Having ridden the market down (Market Rule #1: Don’t get crossways with the trend), it was time to go long the Dec24 issue at the open of September 2024. This long position would’ve been held until late October before being rolled ahead to Dec25 (ZCZ25) at a carry of roughly 25.25 cents. 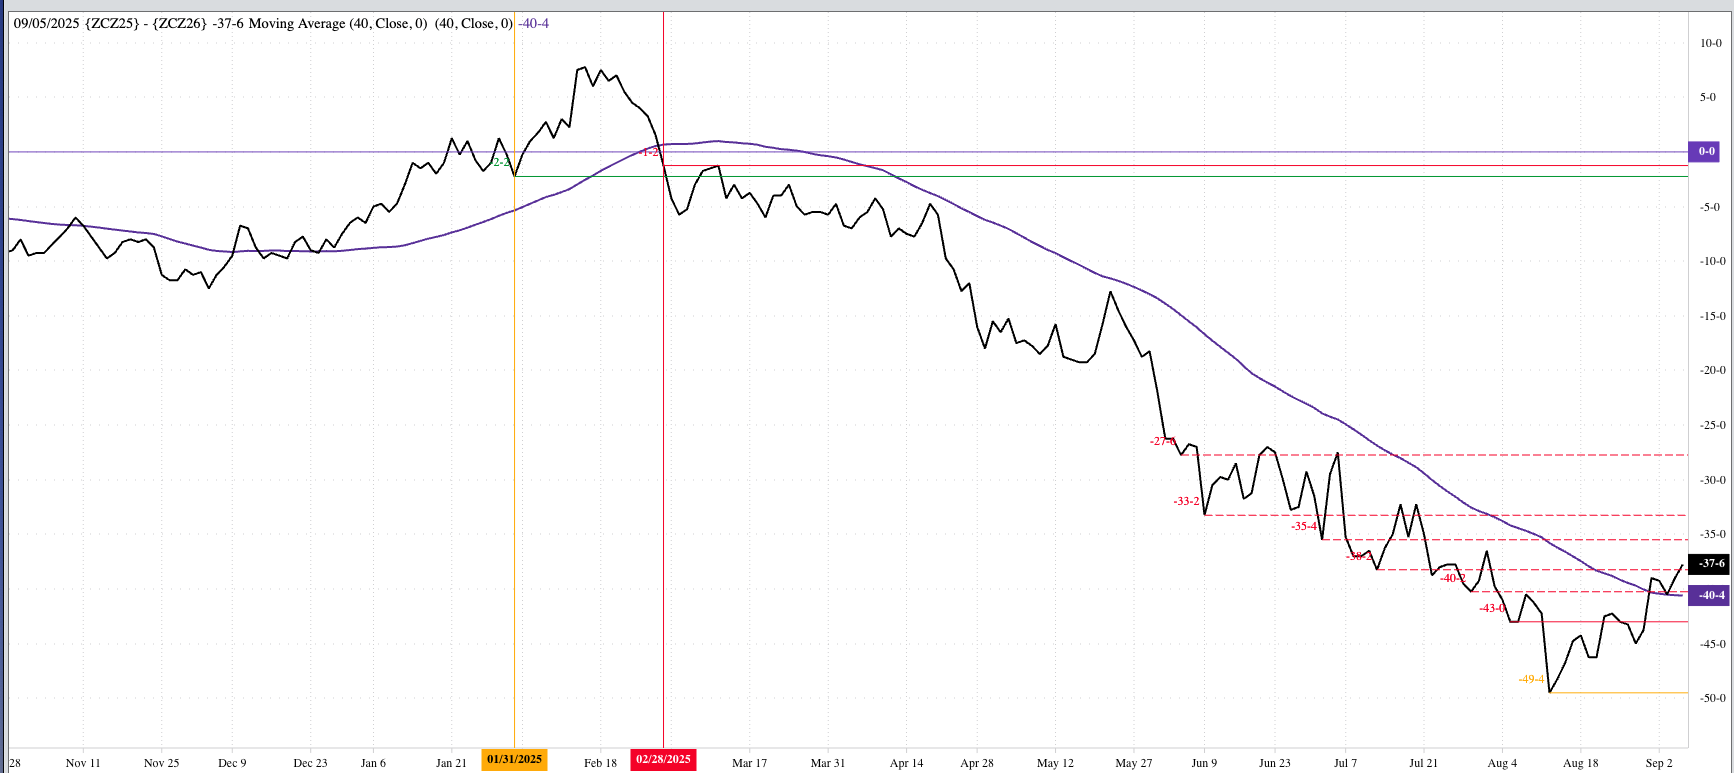 The fund would’ve stayed long Dec25 through early February 2025 when market developments led to another roll forward to Dec26 (ZCZ26) at a carry of 2.0 cents. From there, the Dec25-Dec26 spread collapsed, eventually posting a low daily close of 49.5 cents carry on August 12. Meanwhile, from February through July there were a number of opportunities to add option strategies, taking advantage of both seasonal tendencies and implied volatility readings (both part of Market Rule #3: Use filters to manage risk). The last of these option positions was put in place from mid-July through early August: Buying Dec25 $4.20 calls at 20.0 cents or less. As August came to end, the fund was then theoretically long Dec26 futures (at roughly $4.6225) and Dec25 at-the-money call options. 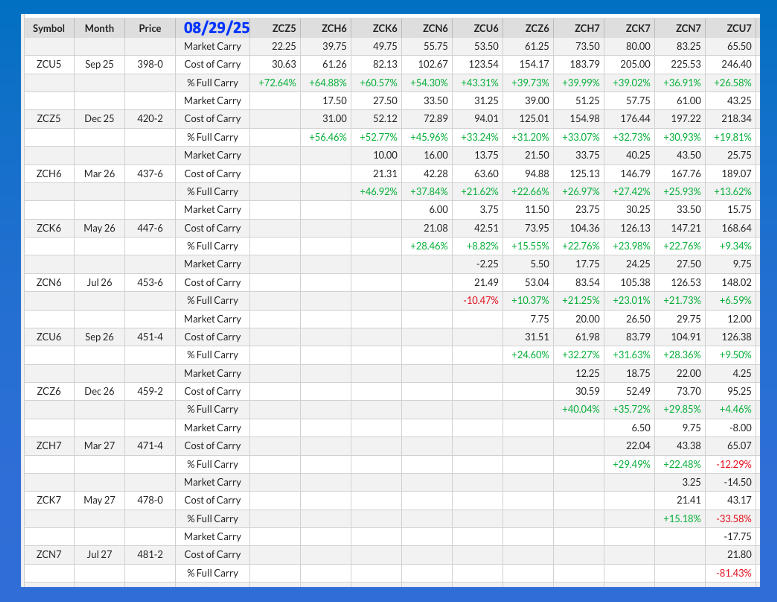 Why be long corn long-term? Market Rules #2 (Let the market dictate your actions) and #6 (Fundamentals win in the end). A look at the corn market’s Cost of Carry table at the end of August showed:
 What stood out to me was the fact the commercial side was bullish corn for Spring 2026 likely on the seasonal tendency for supplies to tighten during planting season in relation to demand. At the end of August 2024, the 2025 edition of the May-July futures spread also closed covering 28% calculated full commercial carry, helping to push the National Corn Index ($CNCI), the national average cash price and intrinsic value of the market, to highs near $4.7050 in February 2025 and $4.6275 during May 2025 after finishing August 2024 at $3.6850. The National Corn Index was priced near $3.7925 at the end of August 2025. Again, why be long corn long-term?
Because of Chaos Theory, an unexpected change at a key time creates a different result, I am not one to say a market will repeat itself from one year to the next. However, this time around the calendar the structure of the corn market is similar enough to view last year as a guide rather than an absolute (recall the Vodka Vacuity that tells us there are no Absolut(e)s in the market). On the date of publication, Darin Newsom did not have (either directly or indirectly) positions in any of the securities mentioned in this article. All information and data in this article is solely for informational purposes. For more information please view the Barchart Disclosure Policy here. |
|
|
